


Keeping an eye on the Magnificent 7 gives you a general sense of the overall market’s health. Weekly support and resistance zones are constantly evolving based on price action. If a weekly candle closes through a zone, that zone is invalidated, and a new one is established. However, if the candle doesn’t close beyond the zone, it remains valid—even if, during the week, price briefly moves across it before pulling back, leaving a wick behind. In that case, the zone may be weakened but still holds significance.
Below are charts displaying only the weekly support and resistance zones—no additional analysis included. These zones can be powerful, but it’s important to think of them as areas rather than fixed lines with exact price points.
(If you see a slash purple or gray line = Support/Resistance may be weaker)

S&P has established a new resistance zone around 5,646 and is currently hovering 0.80% above support. Attempts to break above the daily 9 & 20 EMAs were met with strong rejection, while the weekly EMAs are crossing to the downside—a potential bearish signal. Investors are now focused on upcoming tariff announcements and employment reports, which could influence market direction in the near term.

MAG7 attempted to break above the 9 & 20 EMAs and a weak resistance zone but faced a strong rejection, falling just short of tapping the weekly 9 EMA, which has crossed below the 20 EMA - a potential bearish signal. A new, albeit weak, resistance zone has formed around 1,938, while price is now sitting right on the weekly support zone.

MSFT mirrors the price action seen in previous charts, forming a new resistance zone around 387, while currently sitting right on support.
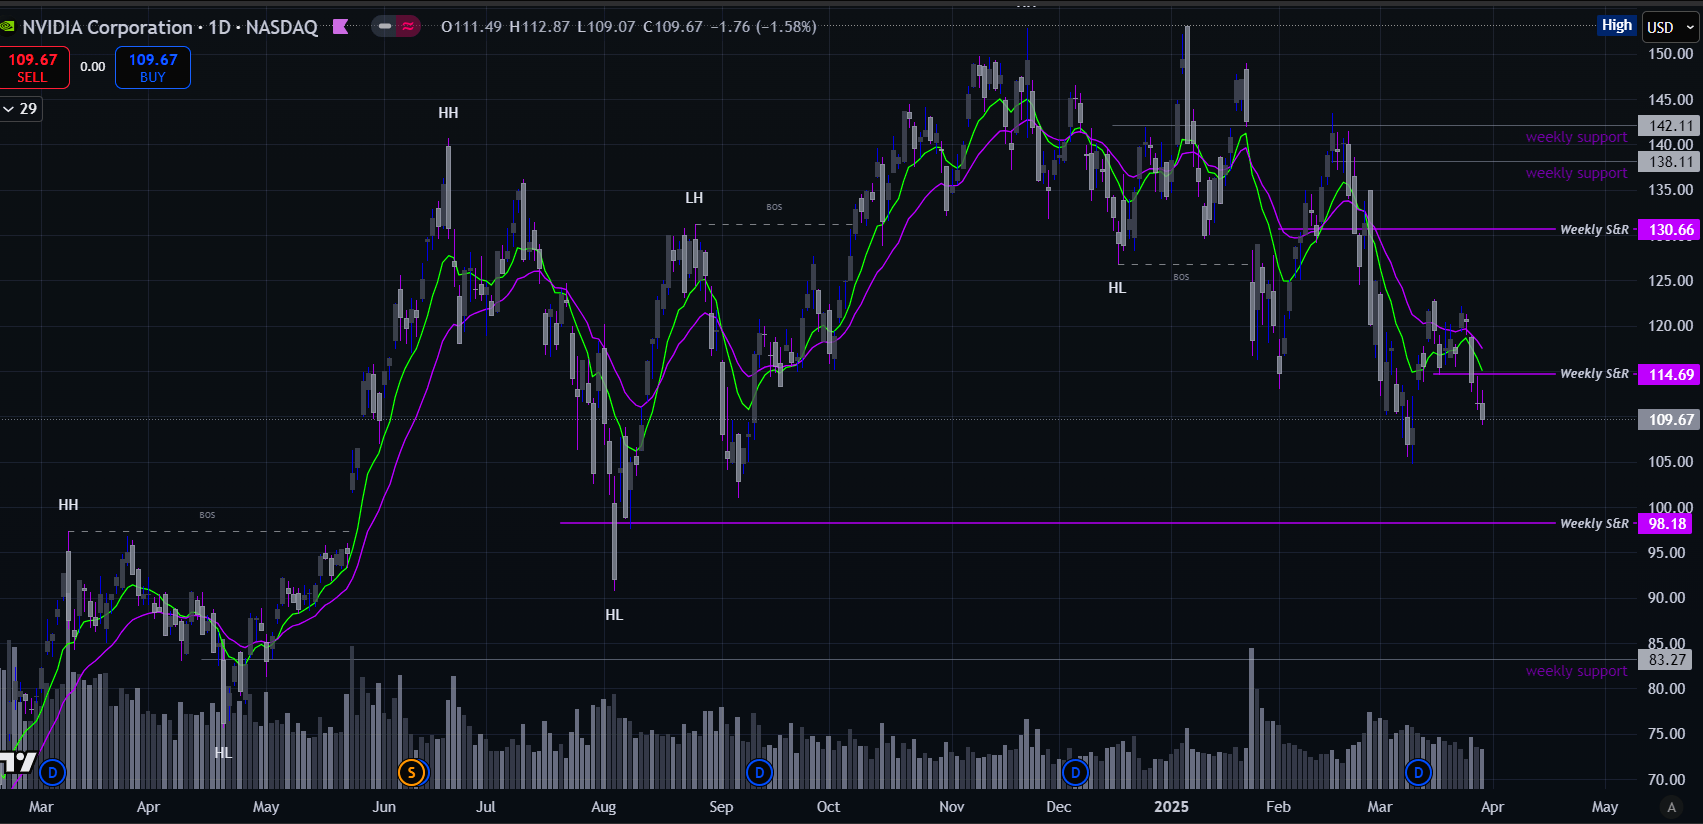
NVDA shows similar price action but has invalidated a support zone after closing the week below it. A new resistance zone has formed around 114, while the price currently sits about 11.34% above the next weekly support level.

AAPL started the week moving higher but was strongly rejected at resistance (starting to see why these zones matter?). It closed just below the previous week's close, now sitting about 4.80% above support and 2.75% below resistance. Like the previous charts, the weekly moving averages have crossed to the downside—a potential bearish signal.

META faced rejection off the 20-day EMA, closing the week lower and forming a new resistance zone around 595. Price is currently about 1.30% above a weak support zone, with a stronger support level sitting below at 543.

TSLA demonstrated relative strength this week, closing higher. The price started the week with a gap up, but faced rejection at the resistance zone. It ended the week approximately 6.10% below that level and is currently sitting about 7.70% above a weaker support zone around 244.
TSLA has been my only trade in the equity market lately. I discussed this play on Wolf Web 3 -X spaces, with an options trade going out about a month, entry around 225. Trade closed out.AMZN closed week lower looking very similar to what we’ve been seeing this week with the MAG 7’s. Price started the week off strong until catching a very strong rejection dead off the weekly resistance zone

AMZN started the week strong with a gap up but was quickly rejected at the resistance zone (yes, dead off resistance, lol), giving back all its gains and closing the week lower. A new resistance zone has formed around 196. While I haven’t removed the weak support zone just below the current price, I feel it may no longer hold, which suggests a new weak support zone around 185. The next significant support zone would be around 180.

till the next one boys, stay safe in these trenches
@0xBadPrice