


Keeping an eye on the Magnificent 7 gives you a general sense of the overall market’s health. Weekly support and resistance zones are constantly evolving based on price action. If a weekly candle closes through a zone, that zone is invalidated, and a new one is established. However, if the candle doesn’t close beyond the zone, it remains valid—even if, during the week, price briefly moves across it before pulling back, leaving a wick behind. In that case, the zone may be weakened but still holds significance.
Below are charts displaying only the weekly support and resistance zones—no additional analysis included. These zones can be powerful, but it’s important to think of them as areas rather than fixed lines with exact price points.
(If you see a slash purple or gray line = Support/Resistance may be weaker)

S&P flashed a potential bearish signal as mentioned last week:
“- a potential bearish signal. Investors are now focused on upcoming tariff announcements and employment reports, which could influence market direction in the near term.”
We saw that warning materialize as markets nuked—price sliced through multiple support zones like a hot knife through butter.
I personally loaded up on "insurance" near the top, as I mentioned during a February episode of Wolf Spaces on X. Those puts paid off, but I also took a loss on hedge calls I bought around March 20th. Overall, the position still worked in my favor. I exited half of it on Friday, capitalizing on the volatility spike.
Now, eyes on Monday’s open: Will price continue to bomb, or can the two nearby support zones catch the fall?
This correction? It was coming with or without tariffs. Markets were inflated and overdue for pain.
Now that the trade war’s back? It’s gonna speed up the bleed.
Sitting on dry powder? Good.
Time to sharpen the blade and build your list—because entries are coming.
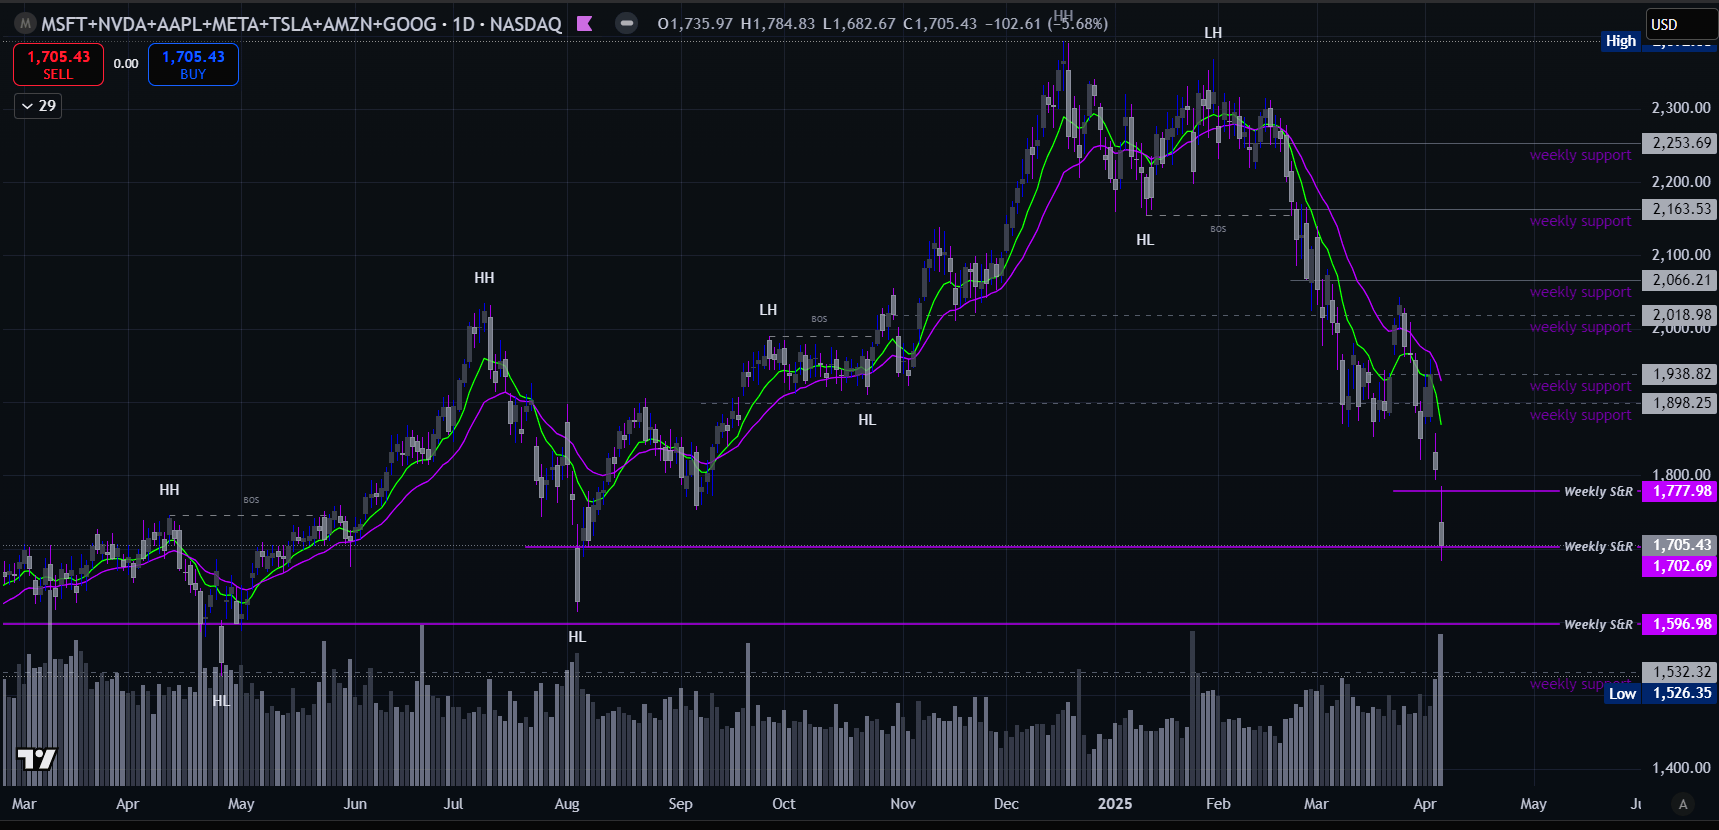
MAG7 lost a combined $1.8 trillion in market value over two trading sessions, ending Friday. Apple alone accounted for over $313 billion of the decline, highlighting the concentrated impact within Big Tech. The losses were triggered by renewed U.S.-China trade tensions following President Trump’s tariff announcements and China’s swift response.
Price gapped down hard and is now sitting right on a key support zone. Many of these charts look nearly identical—sharp gap-downs as price action got crushed across the board.
To save time and stay focused on my prep for tomorrow’s open (I’ve got active trades on), I’m pushing this update out now. Below, I’ve posted the charts with S&R zones for quick reference.

MSFT

NVDA

AAPL
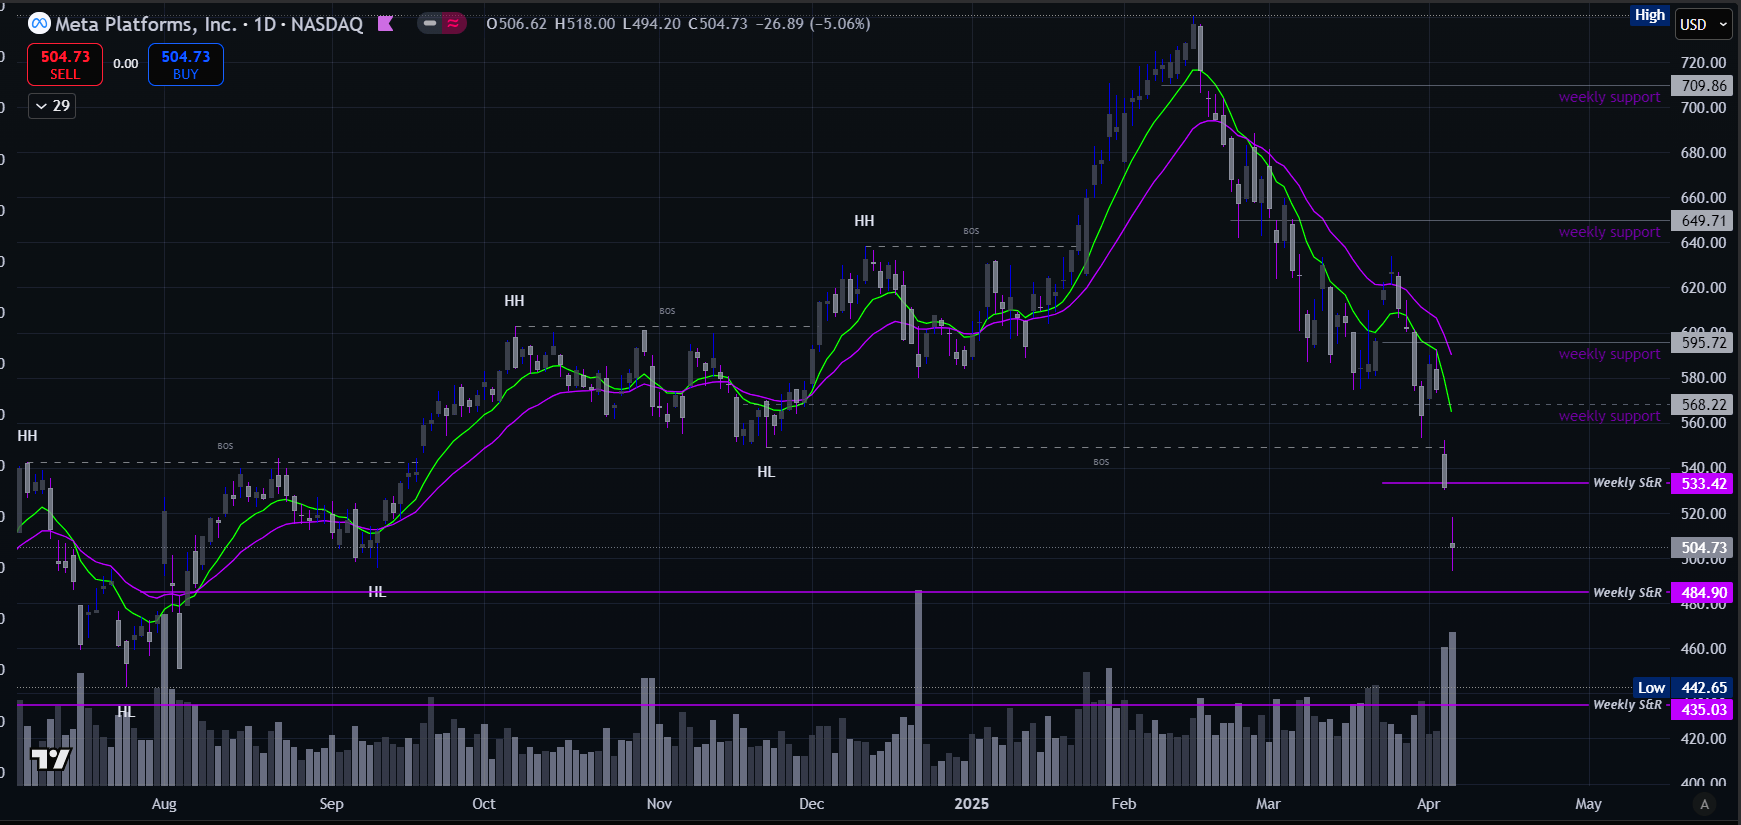
META

TSLA

AMZN
