


Keeping an eye on the Magnificent 7 gives you a general sense of the overall market’s health. Weekly support and resistance zones are constantly evolving based on price action. If a weekly candle closes through a zone, that zone is invalidated, and a new one is established. However, if the candle doesn’t close beyond the zone, it remains valid—even if, during the week, price briefly moves across it before pulling back, leaving a wick behind. In that case, the zone may be weakened but still holds significance.
Below are charts displaying only the weekly support and resistance zones—no additional analysis included. These zones can be powerful, but it’s important to think of them as areas rather than fixed lines with exact price points.
(If you see a slash purple or gray line = Support/Resistance may be weaker)

S&P 500 started the week moving lower to test support, where it caught a strong bounce and followed through with a gap up on Wednesday. Momentum carried into the back half of the week, with price continuing to push higher and closing Friday right up against a key resistance level.

MAG7 traded similarly to the S&P 500 this week, climbing steadily and finishing right at a weak resistance zone heading into the weekend.

MSFT followed a similar path this week, gapping up on Wednesday and breaking through its previous resistance zone, which led to the formation of a new support zone. Price closed the week just below the next resistance zone, which is currently considered weak.
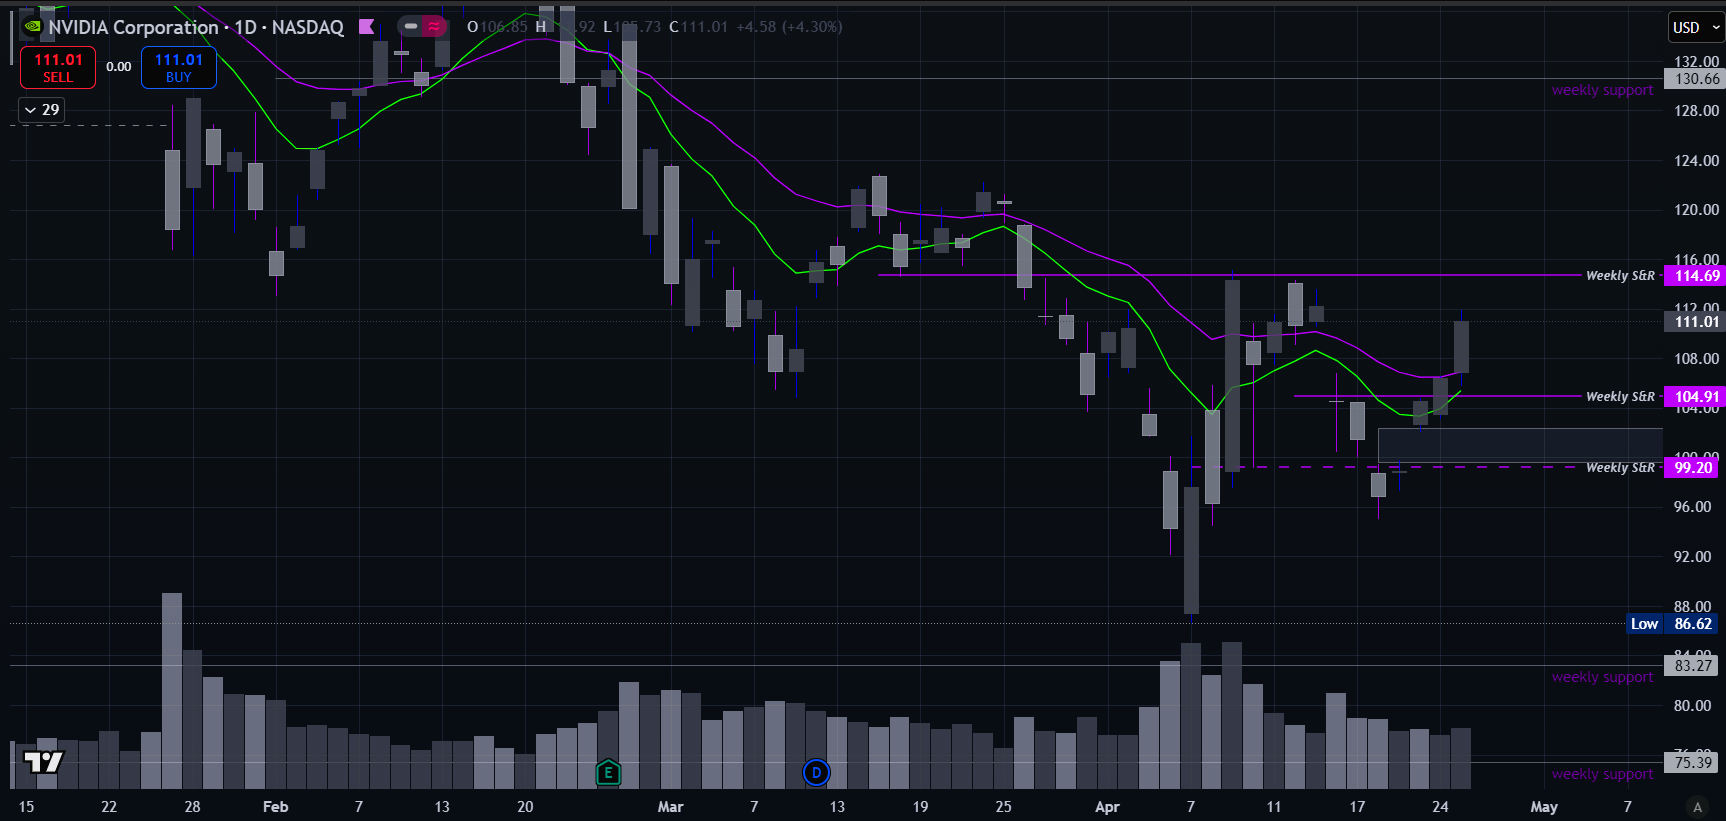
NVDA followed the broader MAG7 trend this week, gapping up at Wednesday’s open, pushing through resistance, and establishing a new support zone along the way.

AAPL started the week moving lower toward support but caught an intraday bounce just before reaching the zone, closing Monday near its highs. Price continued to trend higher throughout the week, breaking through a resistance zone and finishing about 4% above a newly formed support zone.

META started the week moving lower but, like much of the MAG7, caught a clean bounce right off our support zone. Price gapped up on Wednesday’s open, invalidated a resistance zone, and formed a new support zone. META closed the week just above its 20-day moving average, and with moving averages starting to turn, a bullish flip could be setting up in the near future.

TSLA started the week moving lower but caught a bounce off a weak support zone, showing strong follow-through for the rest of the week. Price broke through a resistance zone and established a new support zone, and now sits close to a potential bullish moving average crossover.

AMZN mirrored the broader MAG7 price action this week, breaking through a resistance zone and forming a new support zone just beneath it. When support forms near a recently invalidated resistance, it often leads to a stronger, more reliable zone going forward.

GOOGL, much like AMZN, formed a new support zone directly on top of the resistance zone it invalidated, which should strengthen the area moving forward. Price also saw a couple of gap ups this week, including one on Friday’s open that cleared a resistance zone. While that zone should be considered invalidated, it’s been left in gray on the chart for reference.
