


Keeping an eye on the Magnificent 7 gives you a general sense of the overall market’s health. Weekly support and resistance zones are constantly evolving based on price action. If a weekly candle closes through a zone, that zone is invalidated, and a new one is established. However, if the candle doesn’t close beyond the zone, it remains valid—even if, during the week, price briefly moves across it before pulling back, leaving a wick behind. In that case, the zone may be weakened but still holds significance.
Below are charts displaying only the weekly support and resistance zones—no additional analysis included. These zones can be powerful, but it’s important to think of them as areas rather than fixed lines with exact price points.
(If you see a slash purple or gray line = Support/Resistance may be weaker)
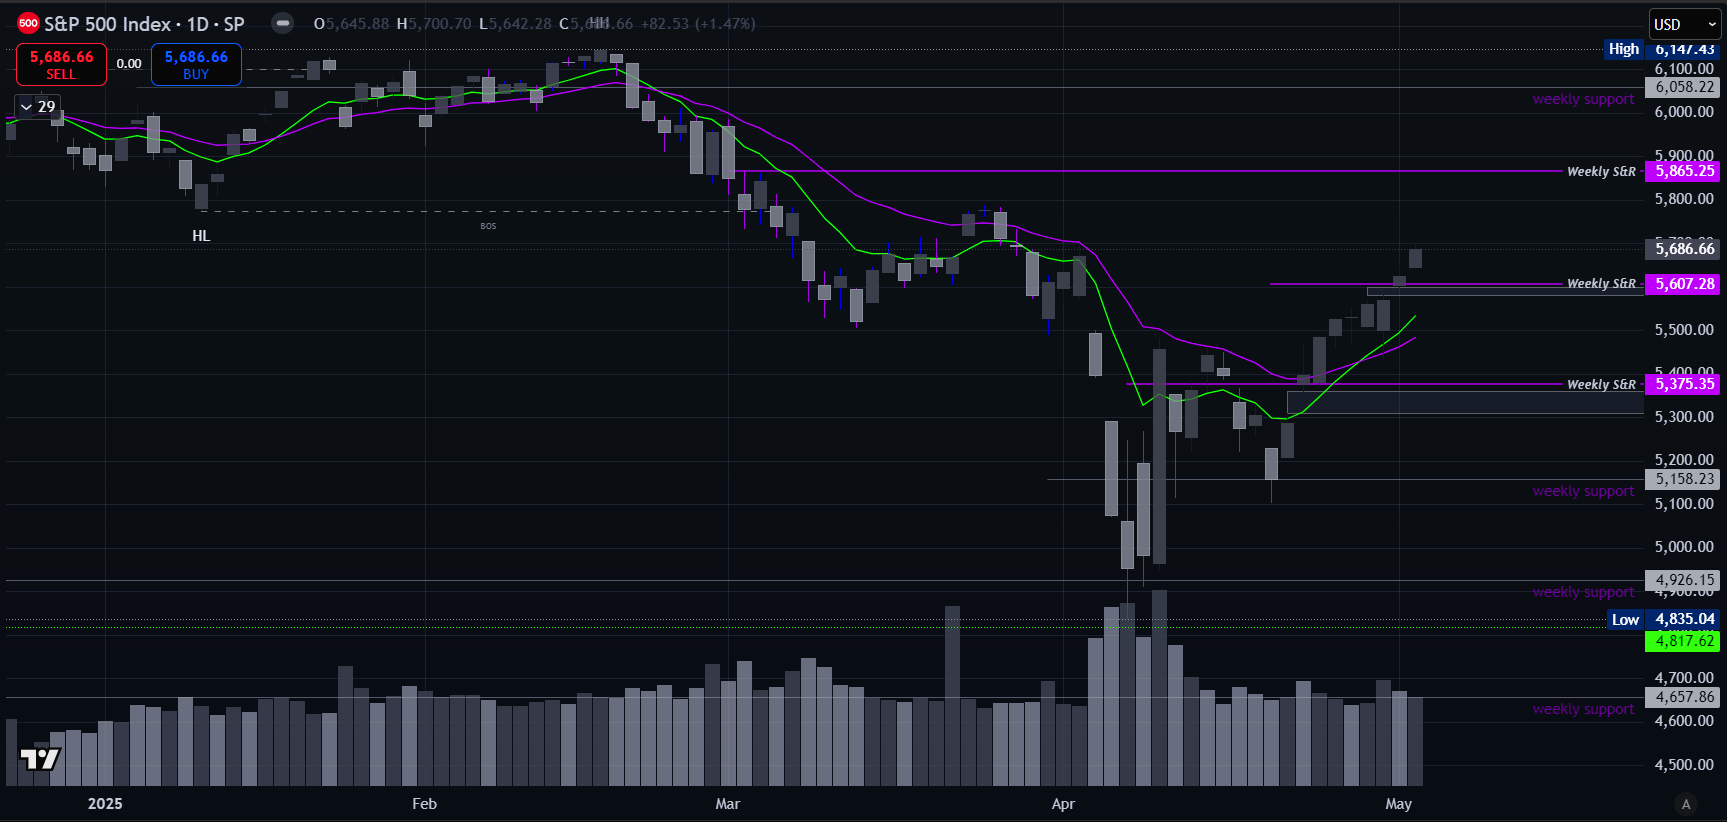
S&P 500 has shown strength during earnings season, breaking above previous resistance to establish new support around 5,600. A key technical development was the bullish crossover of the 50-day and 200-day moving averages, which supports a continuation of upward momentum. However, despite this progress, caution is advised as the index approaches critical resistance zones — notably our marked level around 5,865. Broader economic data, including weak GDP and employment figures, suggest that volatility and potential pullbacks remain a risk in the short term.
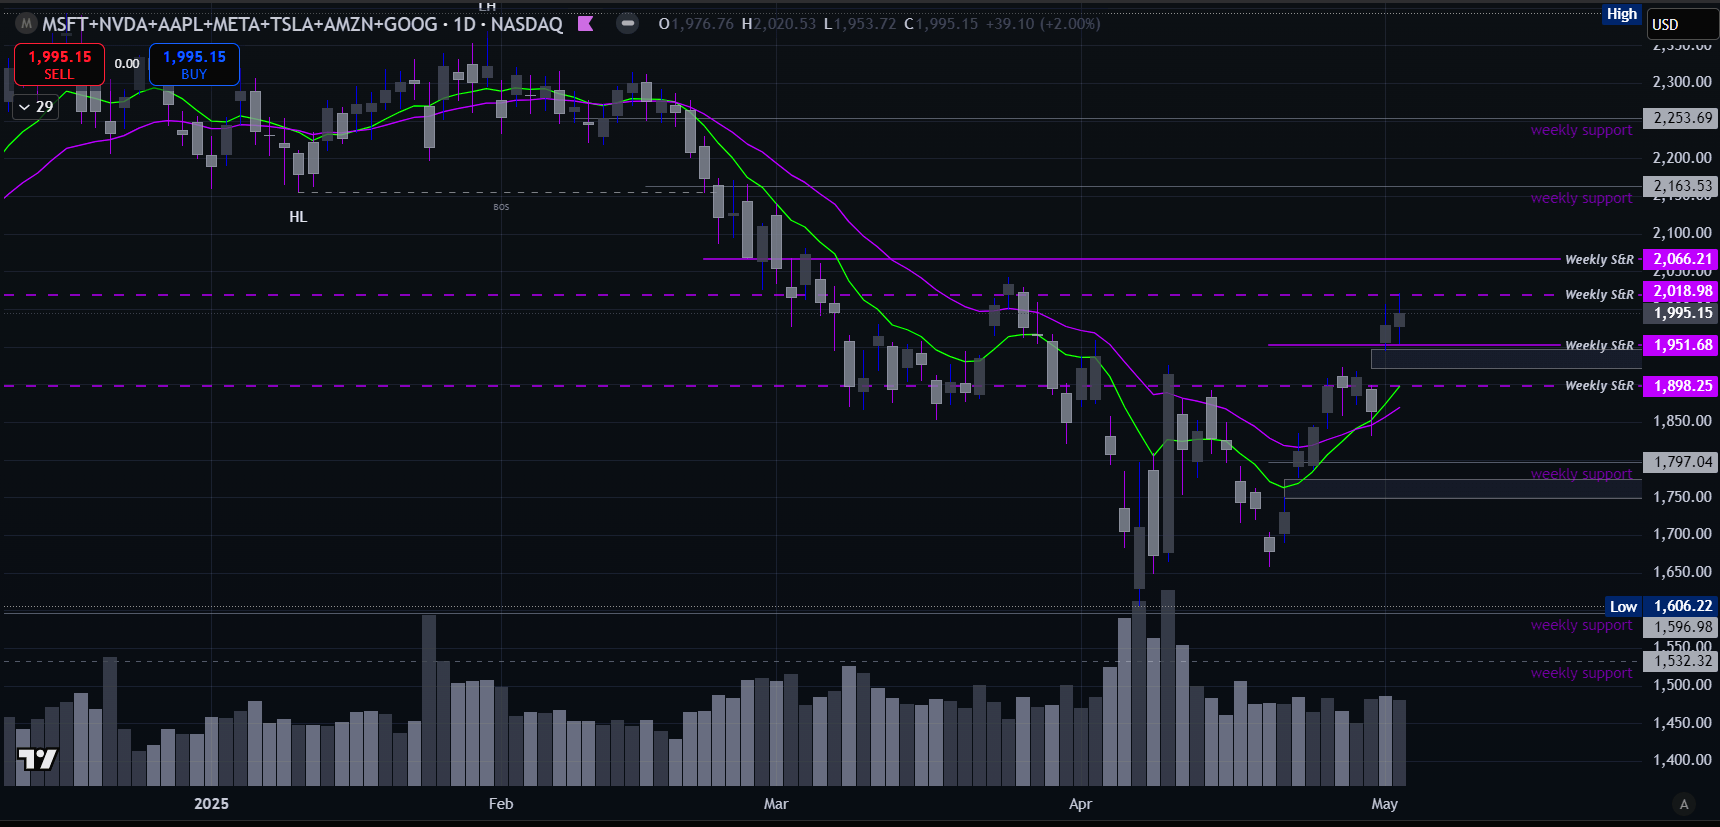
MAG7 pushed through a weak resistance zone and are now testing another, with new support forming around 1,950. So far, earnings have been mixed — Alphabet beat expectations, while Tesla disappointed. Microsoft and Meta report Wednesday, followed by Amazon and Apple on Thursday, and Nvidia later in May. With recent underperformance since February highs, the upcoming results will be key to gauging momentum.

MSFT gapped up on strong earnings, breaking through multiple resistance levels and forming new support around $413. It ended the week testing a major resistance zone. Strong Azure and cloud growth helped push revenue and profits well above expectations, reinforcing bullish momentum.
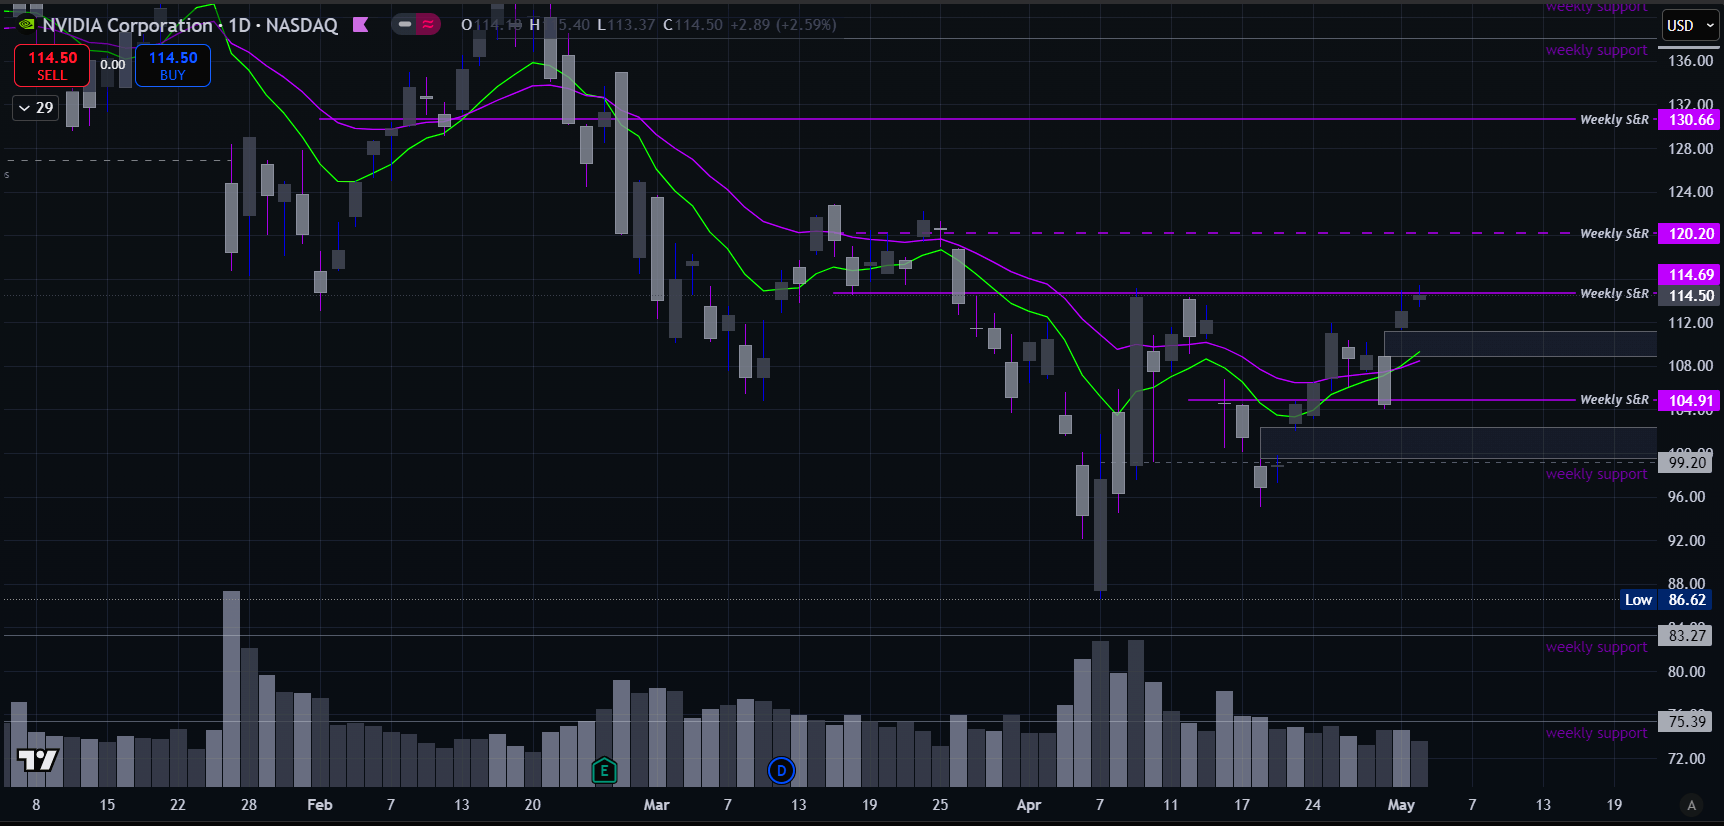
NVDA bounced off support and closed the week near resistance, with earnings due May 28. AMD reports this week, and its results will offer key insight into AI and data center demand — both critical for gauging Nvidia’s upcoming performance.
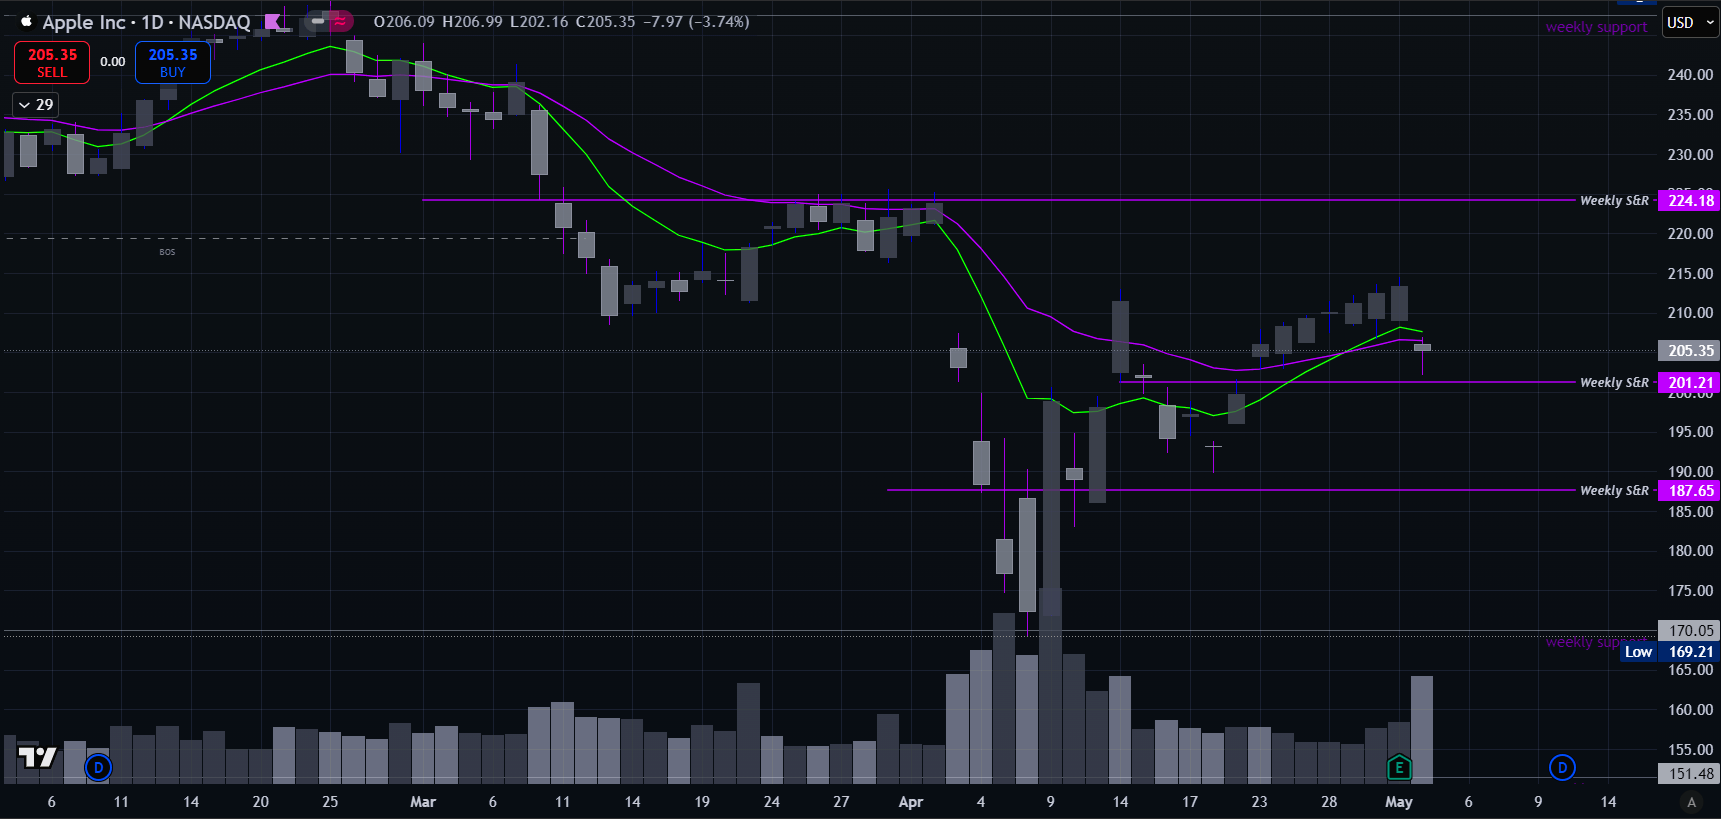
APPL started the week strong but faded to close near support, trading just below EMAs after a bullish cross. Q1 earnings beat expectations with record revenue driven by Services growth, though flat iPhone sales and weaker China performance raised some concerns.
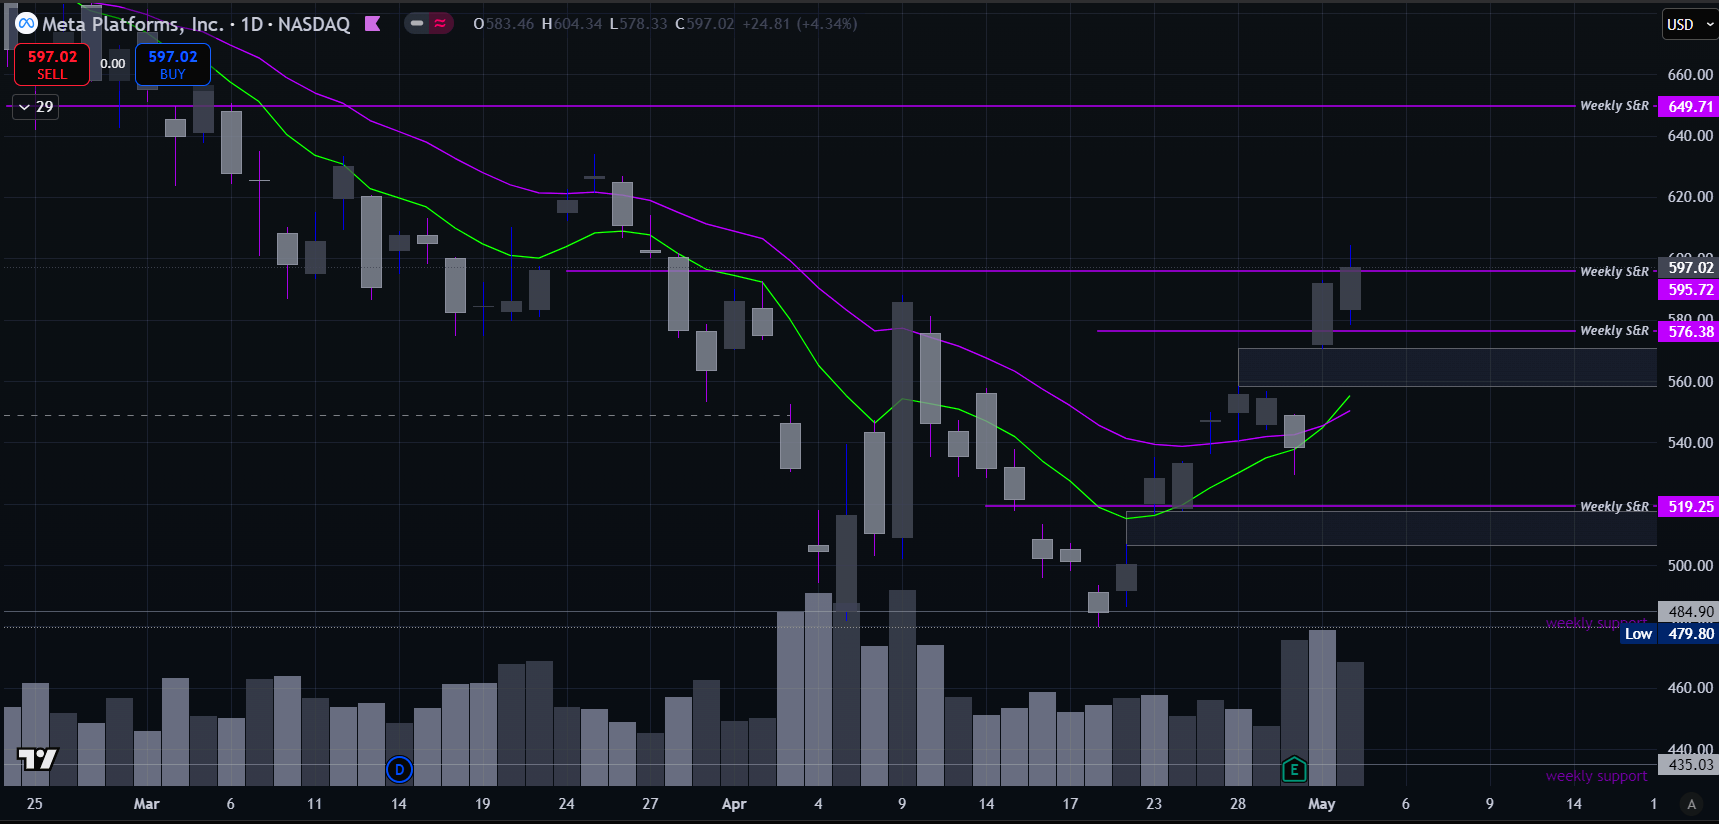
META gapped up after beating earnings on Wednesday, forming new support near $575. The stock closed the week testing resistance, with EMAs nearing a bullish crossover. Strong ad revenue and AI investment drove the beat, despite some headwinds from China and regulatory pressure.

TSLA saw its bullish moving average crossover confirm this week, with price bouncing off the 9-day EMA on Wednesday. It’s now consolidating near the top of its recent range and ended the week holding above a weak support zone.
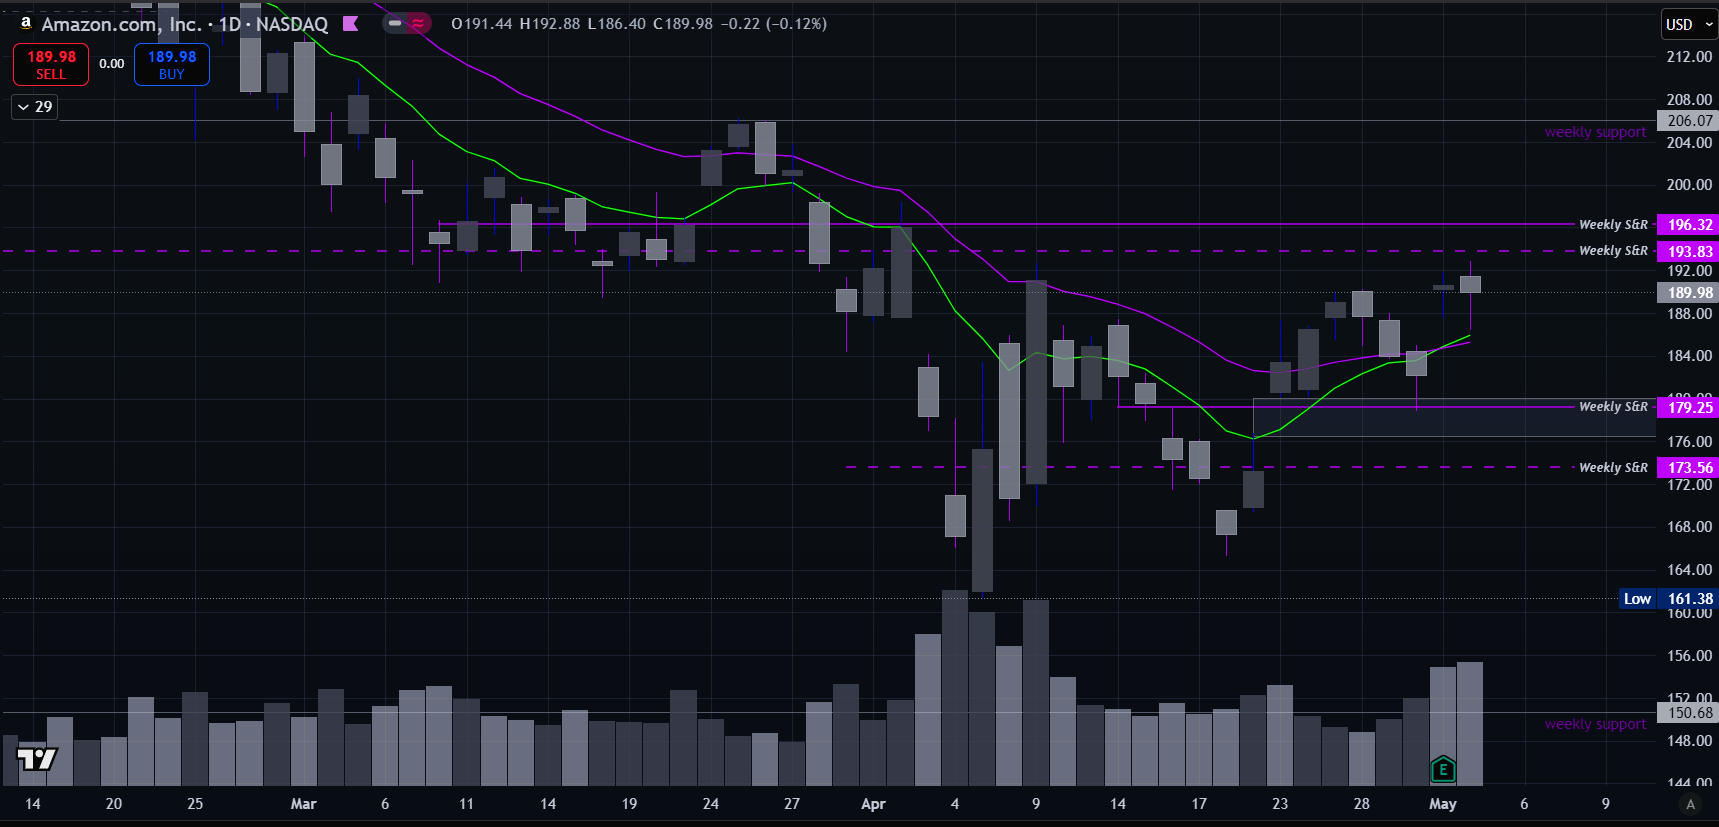
AMZN bounced midweek after testing support, now consolidating near resistance with EMAs close to a bullish crossover. Q1 earnings beat expectations, led by strong retail and ad revenue, though AWS growth lagged slightly and guidance was cautious due to tariff concerns.
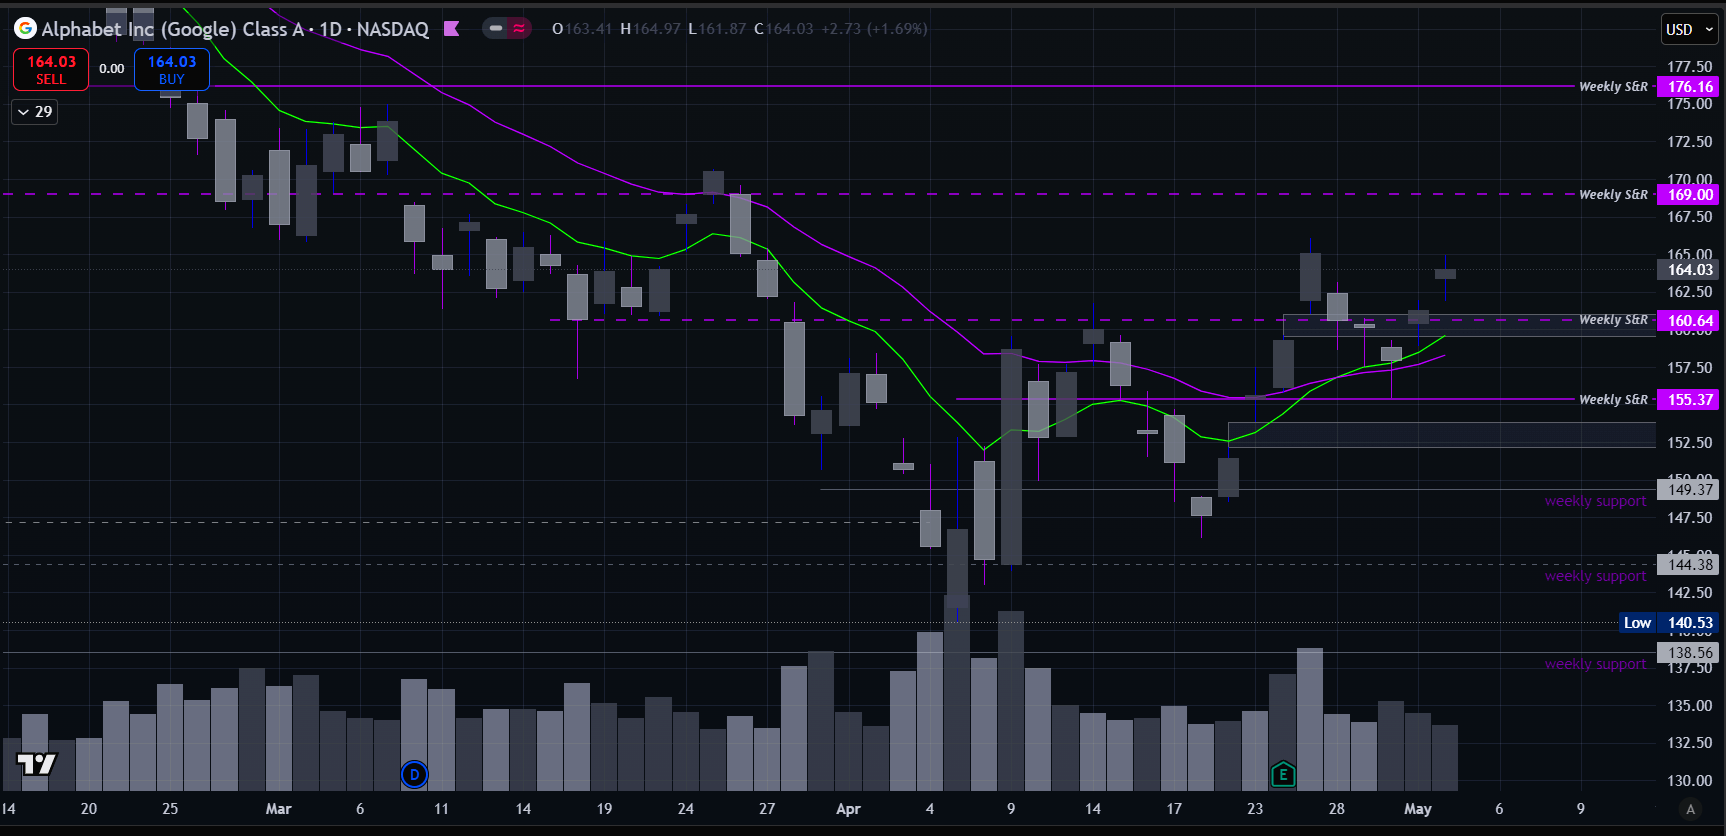
GOOGL started the week pulling back but found support and bounced after testing our support zone. A bullish EMA crossover followed, and price pushed through a weak resistance level—now acting as a weak support zone as the stock holds the top of it’s range.
