


Keeping an eye on the Magnificent 7 gives you a general sense of the overall market’s health. Weekly support and resistance zones are constantly evolving based on price action. If a weekly candle closes through a zone, that zone is invalidated, and a new one is established. However, if the candle doesn’t close beyond the zone, it remains valid—even if, during the week, price briefly moves across it before pulling back, leaving a wick behind. In that case, the zone may be weakened but still holds significance.
Below are charts displaying only the weekly support and resistance zones—no additional analysis included. These zones can be powerful, but it’s important to think of them as areas rather than fixed lines with exact price points.
(If you see a slash purple or gray line = Support/Resistance may be weaker)
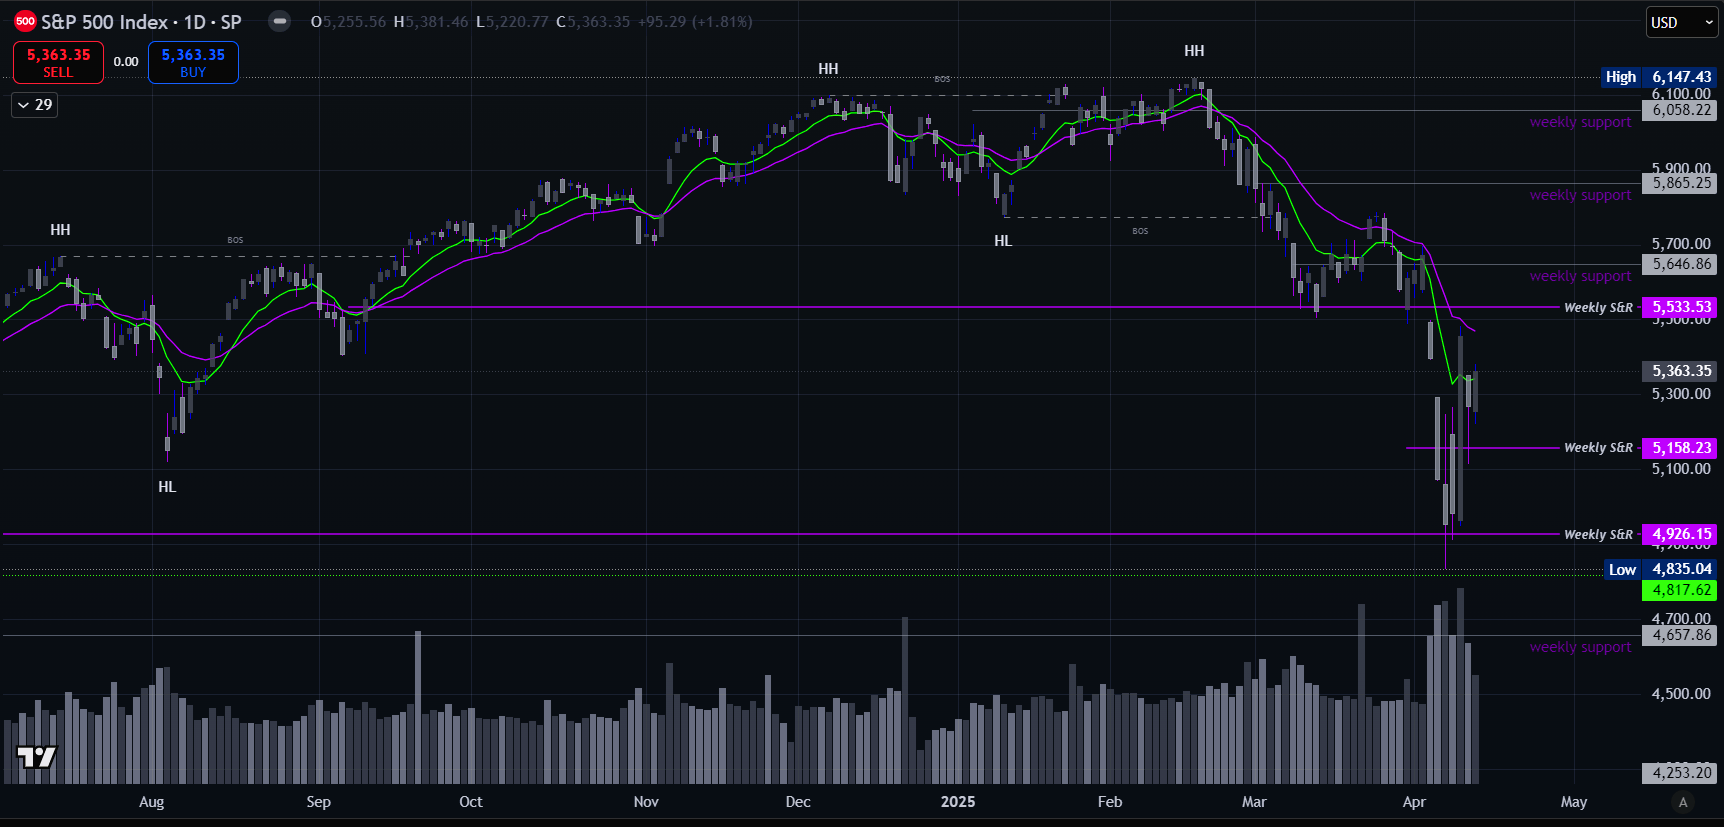
S&P had a strong week, rallying 5.70% and establishing a new support zone. Price is now testing the 9-day EMA after breaking through key resistance. While the bounce is encouraging, both the daily and weekly EMAs remain bearish. To confirm a trend shift, we need to see these new support levels hold. Currently, price sits about 3.68% above support.

MAG7 pushed higher, sliced through resistance, and closed the day right at a key zone—but caught a rejection the next session off that same level and the 20-day EMA. Price now sits on the 9-day EMA, hovering ~5.92% above new support.
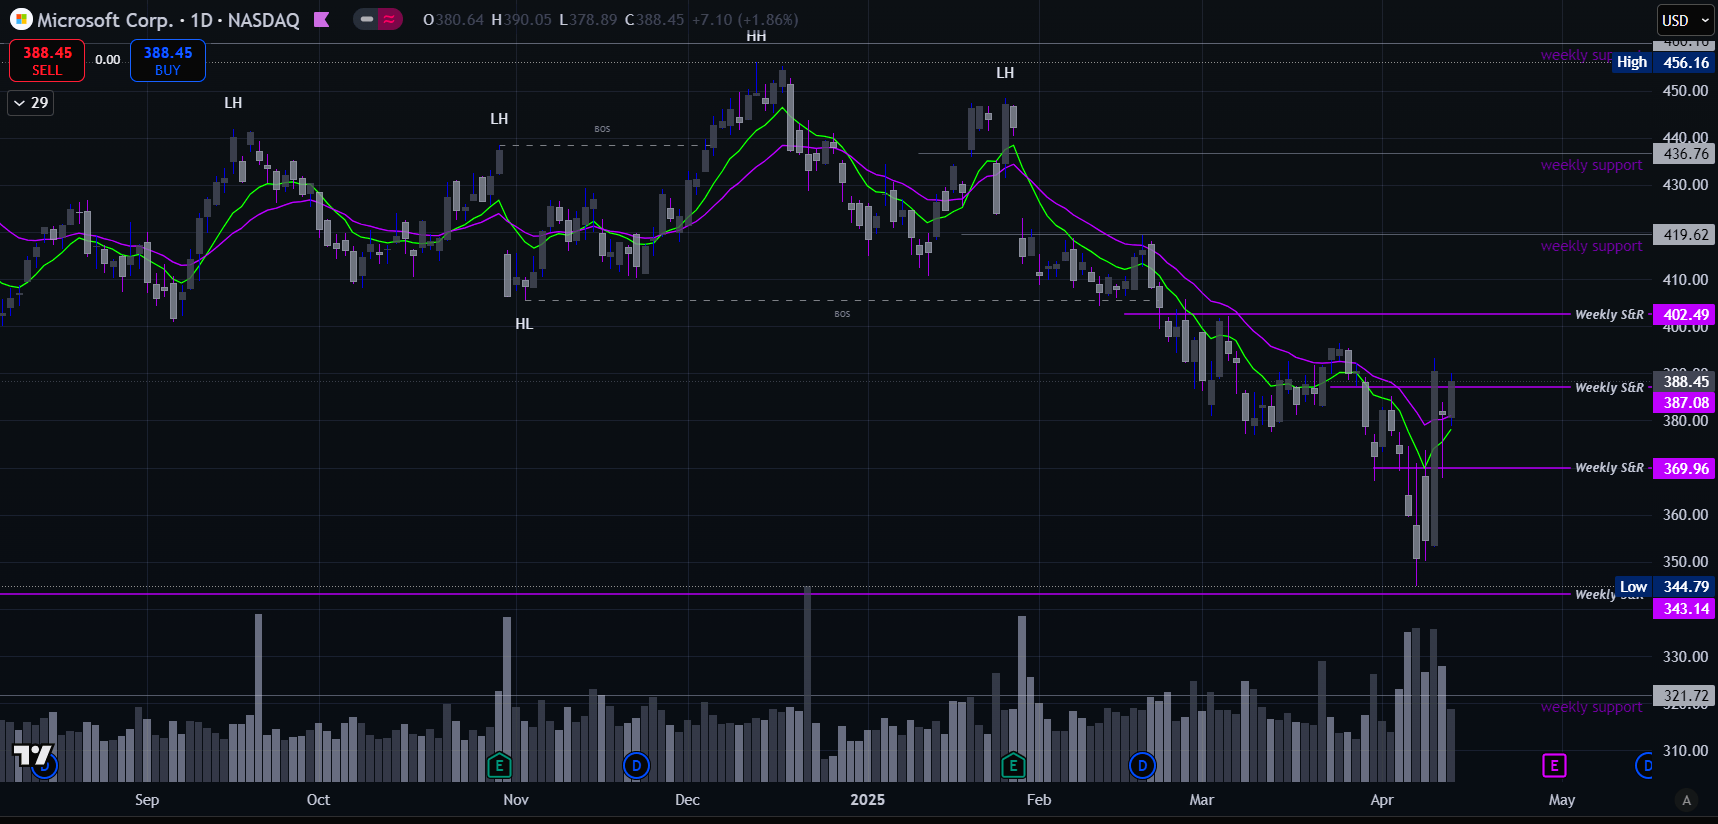
MSFT closed the week up 7.95%, landing right in the resistance zone. Price reclaimed the daily EMAs—a good sign—but both daily and weekly EMAs still lean bearish. New support formed near 370, with price sitting ~5% above that level.

NVDA pushed higher but got rejected clean off resistance. Still, price broke through and carved out new support right at that former resistance—typically a sign of a stronger zone. It’s holding above the EMAs and currently sits ~11.60% above the new support zone.
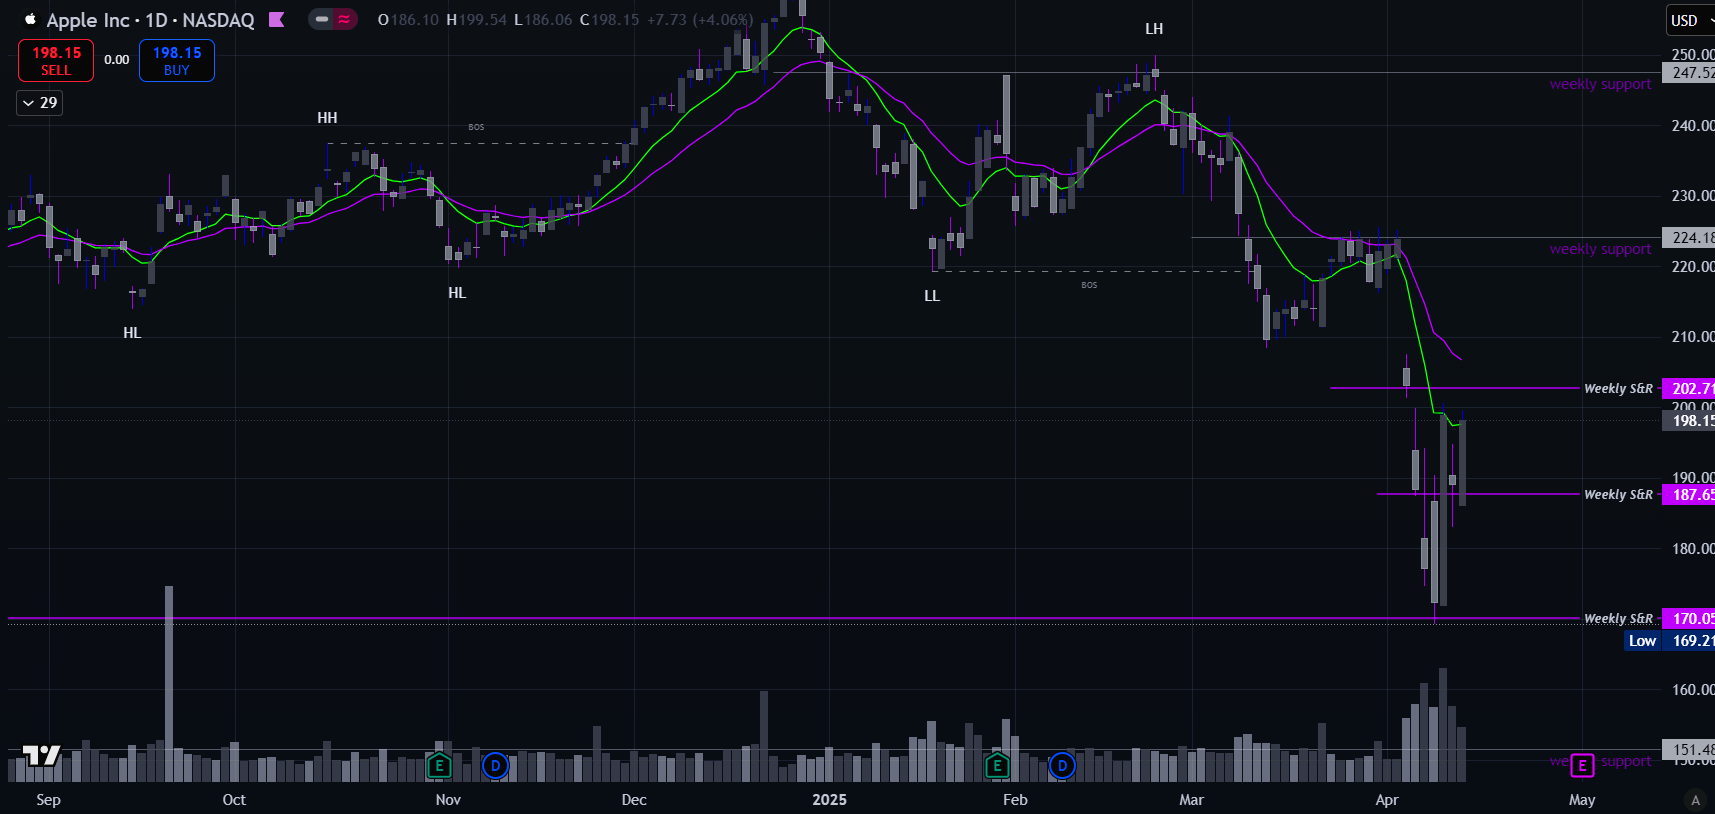
AAPL caught a strong bounce off support and is now resting on its 9-day EMA. It closed the week up 5.19% and holds ~5.40% above its newly formed support zone.

META saw a strong bounce, closed a daily above resistance but quickly rejected. Still, it broke through a key zone this week and formed new support. Price now sits right on top of that prior resistance—technically zone invalidated, but left on the chart in gray as these areas can act as a potential pivot zone.

TSLA bounced off a weak support zone that, surprisingly, is still holding. Price moved higher, cut through a soft resistance area, and ended the week mid-range—carving out a new support zone in the process.

AMZN bounced off support and pushed higher, but caught a rejection at the 20-day EMA—just beneath a weak resistance zone. Price is now sitting on the 9-day EMA after a daily bounce off the prior resistance it broke through this week, left in gray as a potential pivot. New support formed around 173.xx.

GOOGL dipped just below support before bouncing hard, closing the week up 7.98%. That support zone is technically invalid but remains on the chart in gray for reference. Price now sits between its daily EMAs and ~5.30% above the newly formed support zone.
