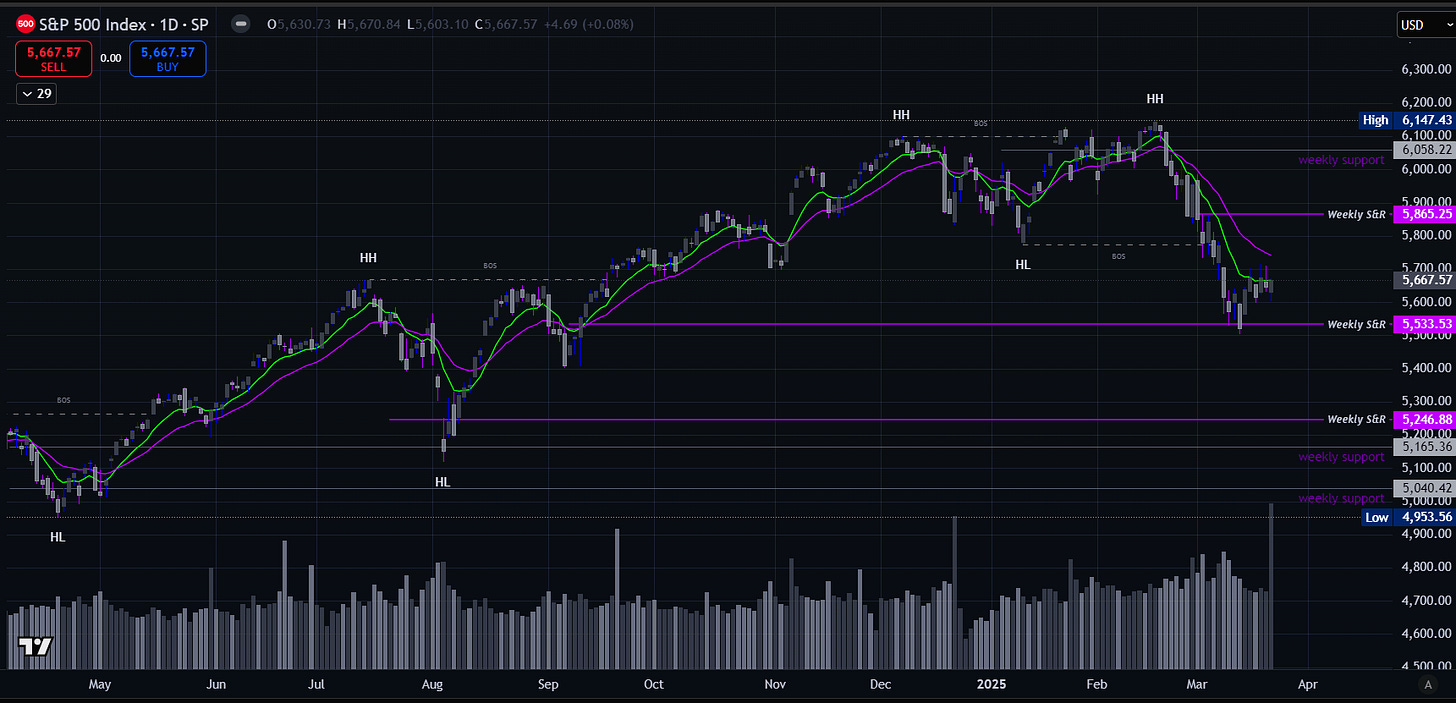
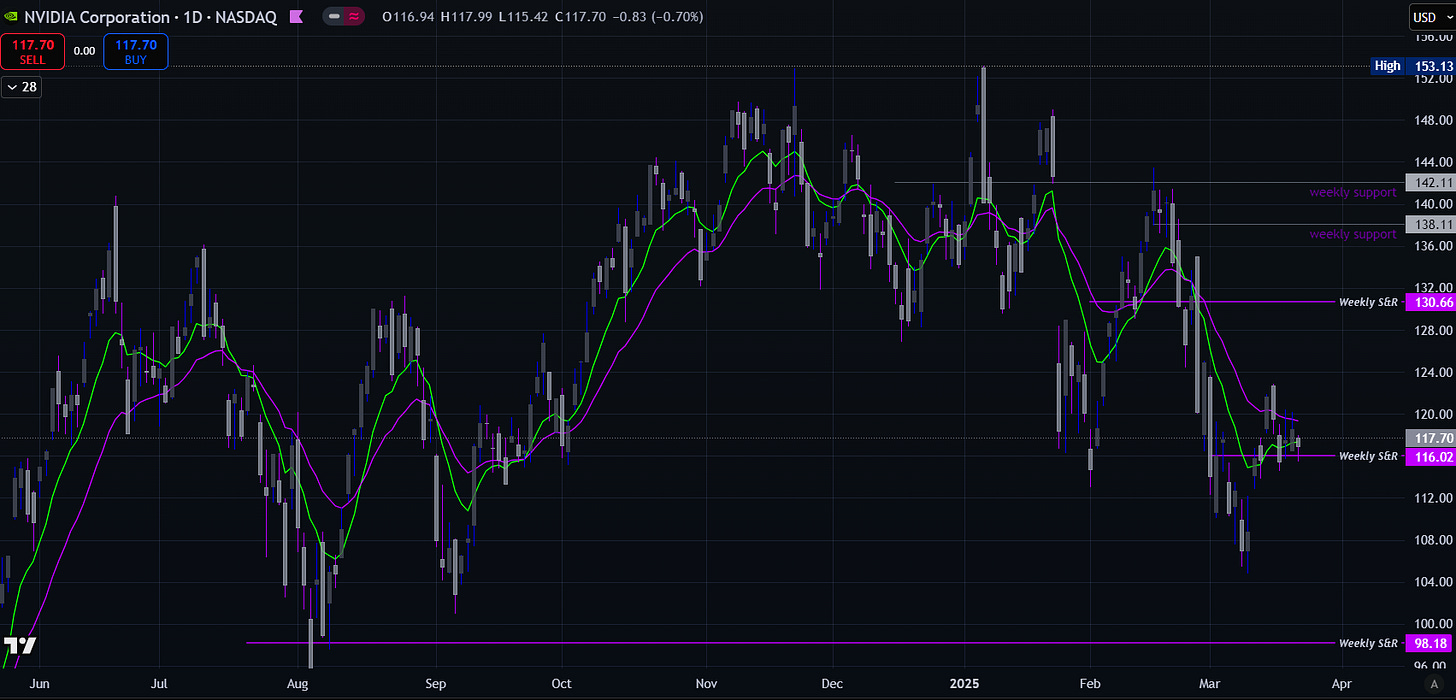
Keeping an eye on the Magnificent 7 gives you a general sense of the overall market’s health. Weekly support and resistance zones are constantly evolving based on price action. If a weekly candle closes through a zone, that zone is invalidated, and a new one is established. However, if the candle doesn’t close beyond the zone, it remains valid—even if, during the week, price briefly moves across it before pulling back, leaving a wick behind. In that case, the zone may be weakened but still holds significance.
Below are charts displaying only the weekly support and resistance zones—no additional analysis included. These zones can be powerful, but it’s important to think of them as areas rather than fixed lines with exact price points.
(If you see a slash purple or gray line = Support/Resistance may be weaker)
S&P closed the week slightly higher, now sitting about 2.40% above the support zone.
MAG.7 dipped below the support zone but closed the week sitting about 1.84% above it.
MSFT closed the week higher, now sitting about 3.20% above support.
NVDA moved lower this week, tested support, and held, now sitting about 1.00% above the support zone.
AAPL closed the week higher, now sitting about 4.90% above the support zone.
META moved lower, breaking under support but closing within the zone. I’ve adjusted the support line to reflect that the zone is still valid but weakened. Also, note the next support zone around 568 is weak but remains valid, while a stronger support zone sits around 543.
TSLA closed the week lower, dipping below support, testing the next level, and bouncing back to finish about 1.30% above the support zone. I’ve adjusted the support line to show the zone is still valid but weakened. The next strong support sits around 207.
AMZN closed the week slightly lower, with support tested multiple times but holding. Price now sits about 1.06% above the support zone.
GOOGL closed the week slightly lower. The price tested the support zone early in the week but recovered, ending about 2.26% above support.


