Keeping an eye on the Magnificent 7 gives you a general sense of the overall market’s health. Weekly support and resistance zones are constantly evolving based on price action. If a weekly candle closes through a zone, that zone is invalidated, and a new one is established. However, if the candle doesn’t close beyond the zone, it remains valid—even if, during the week, price briefly moves across it before pulling back, leaving a wick behind. In that case, the zone may be weakened but still holds significance.
Below are charts displaying only the weekly support and resistance zones—no additional analysis included. These zones can be powerful, but it’s important to think of them as areas rather than fixed lines with exact price points.
(If you see a slash purple or gray line = Support/Resistance may be weaker)
S&P 500 had a shortened trading week with markets closed for Good Friday. Price action saw a rejection at the 20-day EMA, followed by a minor gap down. No new supply and demand zones emerged during the week. As of the latest close, the index sits approximately 2.88% above key support and just below the 9-day EMA.
MAG7 began the week with a clean rejection off our marked resistance zone, followed by a small gap down at Wednesday’s open. A new resistance zone was established around the 1,808 level. Price ended the week sitting right on a vital support zone — if this level fails to hold, the next support zone sits approximately 7.60% lower.
MSFT kicked off the week trying to push through resistance but got rejected again — that was the second test, so I’ve downgraded that zone to weak. Price gapped down at Wednesday’s open and closed the week near the bottom of the support zone. That level is still technically holding, but I’m also marking it as weak for now. A new resistance zone has formed around the 380 area.
NVDA opened the week with a clean rejection off our resistance zone around 114, followed by a gap down at Wednesday’s open. A new resistance zone has formed near the 107 level. Price closed the week just above a key support zone — a critical area to watch heading into next week.
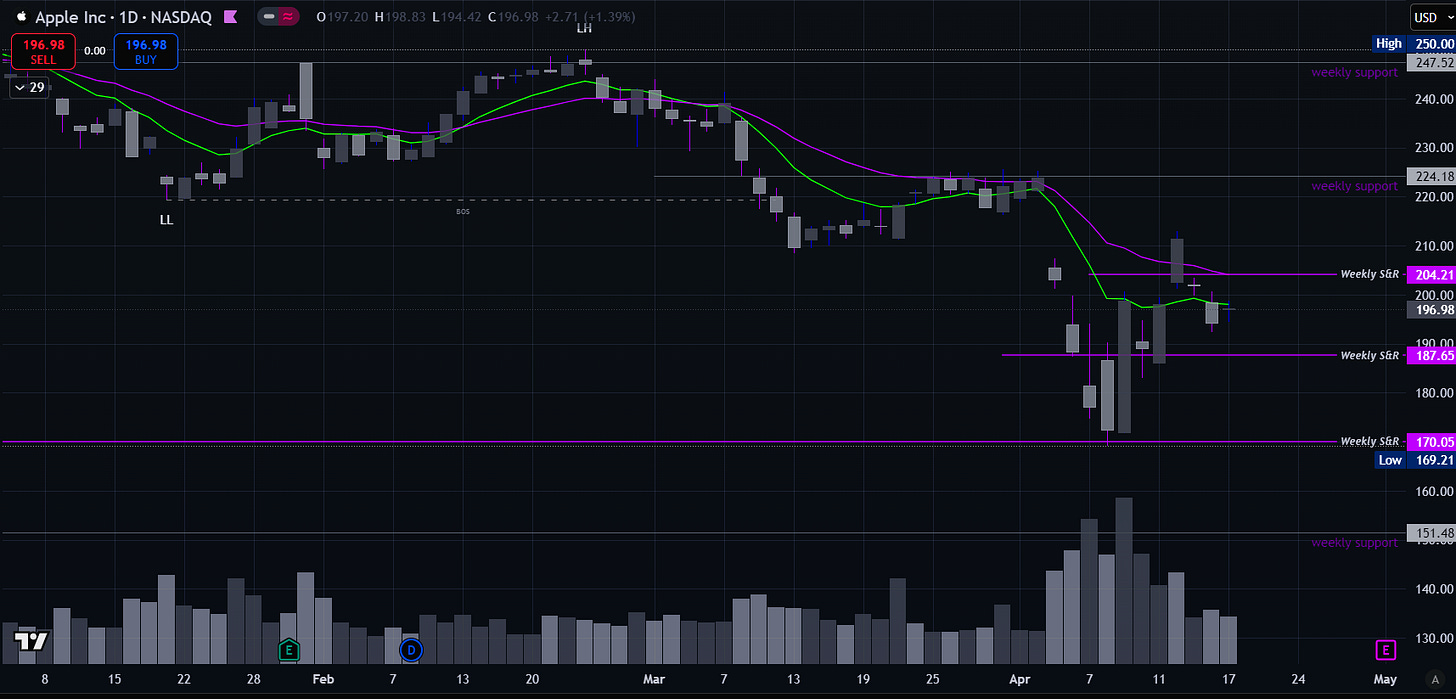
AAPL broke below our support zone this week and formed a new resistance zone in roughly the same area — when this happens, it often strengthens the zone, so it's one to watch. Price ended the week sitting right on the 9-day EMA and roughly 4.80% above the next key support level.
META started the week trending lower, and that downside momentum carried through the rest of the week, including a small gap down. A new resistance zone has formed around the 530 level. Price closed well below the 9-day EMA and sits about 3% above our next support zone.
TSLA kicked off the week attempting to break above its moving averages but got rejected at the 20-day EMA. Price drifted lower throughout the week and ultimately closed right on a key support level.
AMZN started the week moving lower, and that downtrend held steady throughout the week. A new resistance zone formed around the 180 level. Price closed near the lower edge of our support zone — it cut through enough of the level that I’ve downgraded the zone to weak, though it remains valid for now.
GOOGL kicked off the week with a clean rejection off our resistance zone, then trended lower through the rest of the week. A daily support test held, and price closed just above that key zone. It was a bit unclear whether a new resistance zone fully formed, but I’ve marked it as weak for now — better to have it on the radar than miss it.


