


Keeping an eye on the Magnificent 7 gives you a general sense of the overall market’s health. In my effort to start posting more regularly, I’ll be sharing updates like this on weekends, along with my analysis on specific plays—primarily in crypto and equities, though I might occasionally throw in a forex or futures trade.
Weekly support and resistance zones are constantly evolving based on price action. If a weekly candle closes through a zone, that zone is invalidated, and a new one is established. However, if the candle doesn’t close beyond the zone, it remains valid—even if, during the week, price briefly moves across it before pulling back, leaving a wick behind. In that case, the zone may be weakened but still holds significance.
In traditional markets, the weekly candle closes on Fridays after the market shuts down, making it easier for me to send out a quick update over the weekend. Crypto, on the other hand, operates 24/7, with its weekly candle closing on Sundays. I’ll need to figure out the best timing for those updates—whether a quick recap or a more in-depth analysis of my top picks.
Below are charts displaying only the weekly support and resistance zones—no additional analysis included. These zones can be powerful, but it’s important to think of them as areas rather than fixed lines with exact price points.
(If you see a slash purple or gray line = Support/Resistance may be weaker)

The S&P tested, held, and bounced off weekly support. Currently, the price is about 1.82% above the support zone.

MAG.7 tested, held, and bounced off weekly support. Currently, the price is about 2.40% above the support zone.

MSFT tested, held, and bounce off weekly support. Currently, the price is about 2.40% above the support zone.

A new support zone has formed for NVDA. The price spent several days below its weekly support zone but closed the week above it. Currently, it is about 4.88% above the new support zone.

A new resistance zone has formed for AAPL. The price broke below and closed under support, making a new resistance zone. Currently, it is about 2.80% above the current support level.

(Left some Spider Lines on the chart)
META tested, held, and bounce off weekly support. Currently, the price is about 1.80% above the support zone.

TSLA's price dipped below weekly support, tested a weaker support zone, but ultimately closed the week about 2.30% above the current support level.
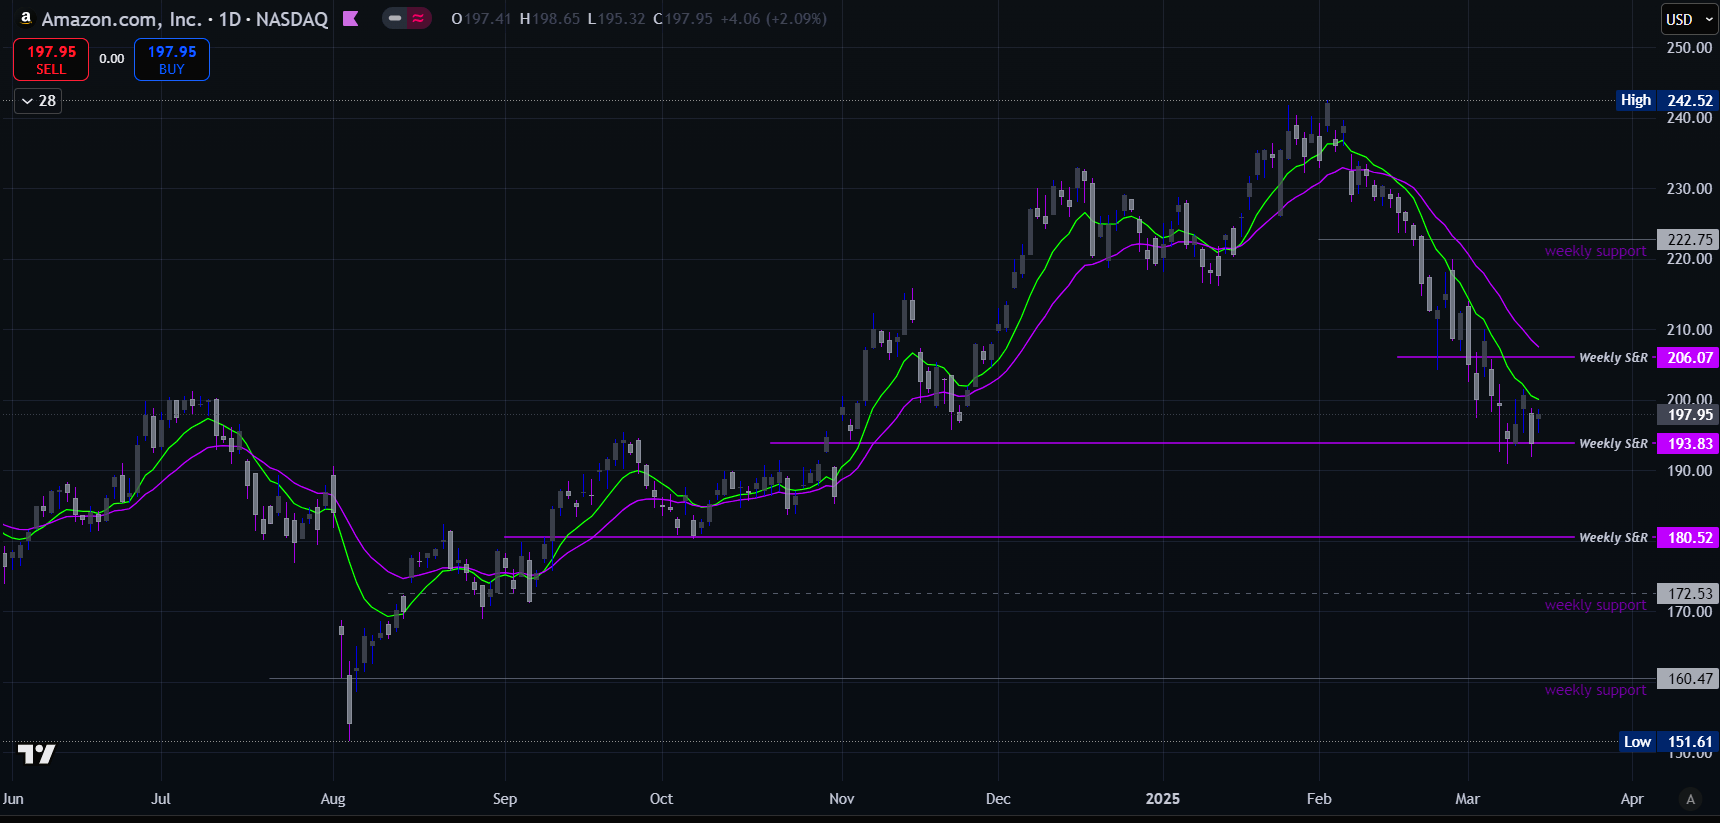
AMZN tested, held, and bounce off weekly support. Currently, the price is about 1.94% above the support zone.

GOOGL price is currently about 2.00% below resistance and 3.20% above support.

Lfggggg
going to start posting way more, also i had a bunch of other tickers i wanted to toss in but said i reached my limit for the email readers and i just wanted to get this out, next time i will send out several parts and will also be updating the Weekly S&R zones from week to week