


Crypto Weekly S&R
Weekly S&R Levels TOTAL3, USDT.D, BTC, ETH, SOL, XRP


I use my weekly support and resistance zones to help manage risk and stay on the right side of the trade. Most of my trading revolves around these zones, using them for entries, exits, and identifying potential price bounces or rejections. The zones remain valid until a weekly candle closes clearly beyond them. Below are charts showing these zones, along with summaries.

BTC closed the week higher and is pushing toward resistance as I write. The price finally closed above the previous resistance zone, which had been tested multiple times. Last week, a daily candle closed above it, but the weekly close remained below, weakening the zone while keeping it valid. With this week's close above resistance, a new support zone has formed. Price has been ranging, with the VAH (Value Area High) around 88,840.

TOTAL3 represents the total market capitalization of all cryptocurrencies excluding Bitcoin (BTC) and Ethereum (ETH). It is used to gauge the strength and performance of the altcoin market without the influence of the two largest cryptocurrencies.
TOTAL3 closed the week higher, forming a new but weak support zone. With BTC pushing higher, I’m watching for strength to return to the altcoin market. Keep an eye on TOTAL3 for a potential move toward resistance.

USDT Dominance Chart (USDT.D) tracks the market dominance of Tether (USDT) relative to the total cryptocurrency market capitalization. It shows the percentage of the market held in USDT rather than in volatile crypto assets.
USDT dominance acts as a fear/greed gauge, helping traders anticipate shifts between risk-on and risk-off environments. Basically, when USDT dominance rises, traders are moving from crypto into stable coins, and when it falls, they’re rotating back into crypto. This week’s candle initially moved up, but as I write, it has reversed sharply as the crypto market pushes higher.
This is a good sign. If the altcoin market were rising while USDT.D also moved higher, that divergence would be a red flag, suggesting the rally might not be sustainable. Keep an eye on this chart—we want to see USDT dominance drop toward support while altcoins regain strength.
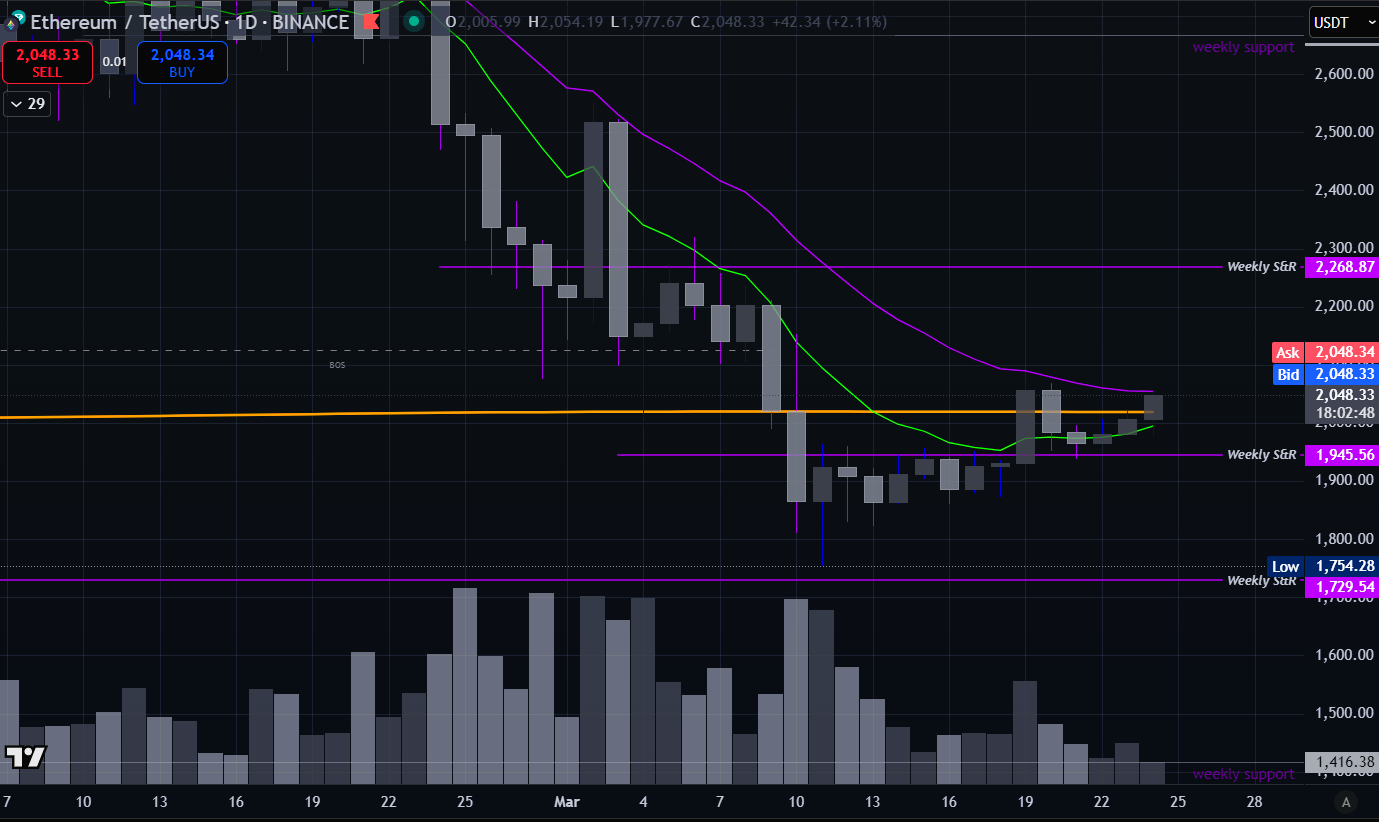
"ETH closed the week higher, breaking through the 9-day EMA and previous support, forming a new support zone. Currently, the daily price is testing the 20-day EMA, which sits above the 9-day EMA. For a stronger bullish signal, we want to see momentum return, leading to a bullish crossover where the 9 EMA moves above the 20 EMA.
Zooming out, the weekly support zone that held and sparked a bounce was a critical level, aligning with a key macro Fibonacci level. That deeper analysis deserves its own article—looks like I’ll be writing that up for you all soon.

SOL also closed week with price getting over the 9 day ema and even though a new weekly support zone did not form, you could take note of the 127-129 area as zone of possible support, though probably not strong enough for me to even mark as a weekly support zone. The next test is to see if price will have the strength to make a run towards resistance and if we can get a bullish moving average cross.

XRP closed the week higher and is currently about 3.20% above a weakened weekly support zone. After a strong bounce off its 20 EMA, the price is attempting to reclaim the 9 EMA on the weekly timeframe. Meanwhile, on the daily timeframe, a bullish moving average crossover is forming.
Right now, XRP is sitting just above its range Point of Control (POC), with the Value Area High (VAH) around 2.67.
